Changelog

Changelog

New features, improvements, and fixes across Nyx — policy enforcement, observability, and AI-assisted workflows for Kubernetes.

Orbit

Nyx Orbit — explore a live cluster, no signup

Nyx Orbit is a live, read-only Nyx environment open to everyone at orbit.tracenyx.ai. It's the actual product watching a real Kubernetes cluster — Linux and Windows workloads, live traffic, live alerts — with no signup and nothing to install.

Three guided missions give you a path if you want one: diagnose a workload that can't reach Key Vault (its logs blame auth — the network tells the real story), investigate an alert for a destination a workload has never contacted before, or ask the cluster questions in plain English and watch answers come back from live flow data. Or skip the missions and just explore — the traffic map, flow logs, dashboards, and policy drawer are all open.

We built Orbit because evaluating cluster security tooling usually means deploying a privileged agent before you know whether the product is any good. Orbit flips that: see everything first, install when you've decided it's worth your cluster.

Explore a live cluster in Orbit

Also in this release — Nyx 1.1.1

  • Flow direction accuracy — a class of egress deny flows was being recorded as ingress; direction is now resolved correctly across the board.
  • Hostname visibility gaps closed — flows that intermittently missed their TLS hostname now resolve it reliably, and DNS-based hostname attribution is now tracked per pod for the pod's lifetime, giving more stable FQDN resolution on busy nodes.
  • Load-balancer ingress no longer double-counted — traffic arriving via a load balancer was recorded twice in some node configurations.
  • Windows flow processing aligned with Linux — the Windows agent's flow-log pipeline was reworked to match Linux behaviour exactly, with test coverage to hold the line. Parity that's real, not a checkbox.
  • First-seen alerts hold their window — first-seen destination alerts now stay visible and investigable for their full intended duration, and resolved events report their true peak instead of zero.
  • Alert accuracy in the feed — "last fired" now shows the actual last firing time after an alert resolves, and alert descriptions now describe each rule's real condition (first-seen and anomaly rules no longer borrow threshold wording).
  • Tidier egress maps — many sibling hostnames under one parent domain now collapse into a single *.parent (N destinations) entry past a threshold, keeping the topology readable for chatty workloads.
  • Alert history improvements — new 6-hour range (now the default), paging for long histories, and an explicit notice when the display cap is reached.
  • In-product guidance — feature tours and tooltips across the topology map, service graph, flow logs, and dashboards; product and namespace detail panels; a per-workload detail sheet.
Nyx 1.1

From seeing to understanding

Nyx 1.0 gave you kernel-native visibility and control over your cluster's network — on Linux and Windows nodes alike, with a minimal footprint. Nyx 1.1 goes from seeing your network to understanding it: it learns what normal looks like, flags what isn't, watches your workloads' health, and lets each team focus on its own slice of a shared cluster.

Anomaly detection

Nyx now learns what normal looks like for each namespace — a seven-day, time-of-week-aware baseline of connection and deny rates — and raises an alert when behaviour deviates from it. A namespace that's quiet every night but suddenly chatty at 3am gets flagged, even if the same traffic level would be unremarkable at noon.

Every anomaly comes with a plain-language, AI-generated explanation of what fired and why. Detection itself is statistical; the AI's job is to make the alert readable — what changed, compared to what baseline, and where to look next.

Anomaly detection starts working once the baseline has learned your cluster's rhythm. Nyx observes before it alerts — a fresh install won't cry wolf on day one.

First-seen destination alerts

The classic exfiltration and command-and-control signal: a workload reaches out to an external host it has never contacted before. Nyx now alerts the first time it happens.

Because TLS destinations are captured via SNI, this covers HTTPS endpoints by hostname — not just IP. A new connection to an unfamiliar domain is visible as exactly that.

With this release, Nyx watches for suspicious behaviour four complementary ways: a fixed line you set (thresholds), a known-bad signature (metadata-API probes, lateral movement), unusual-for-you (anomaly detection), and never-seen-before (first-seen destinations). One detection model misses what the others catch.

Workload health

Network security tools usually stop at the wire. Nyx now understands the workloads behind it.

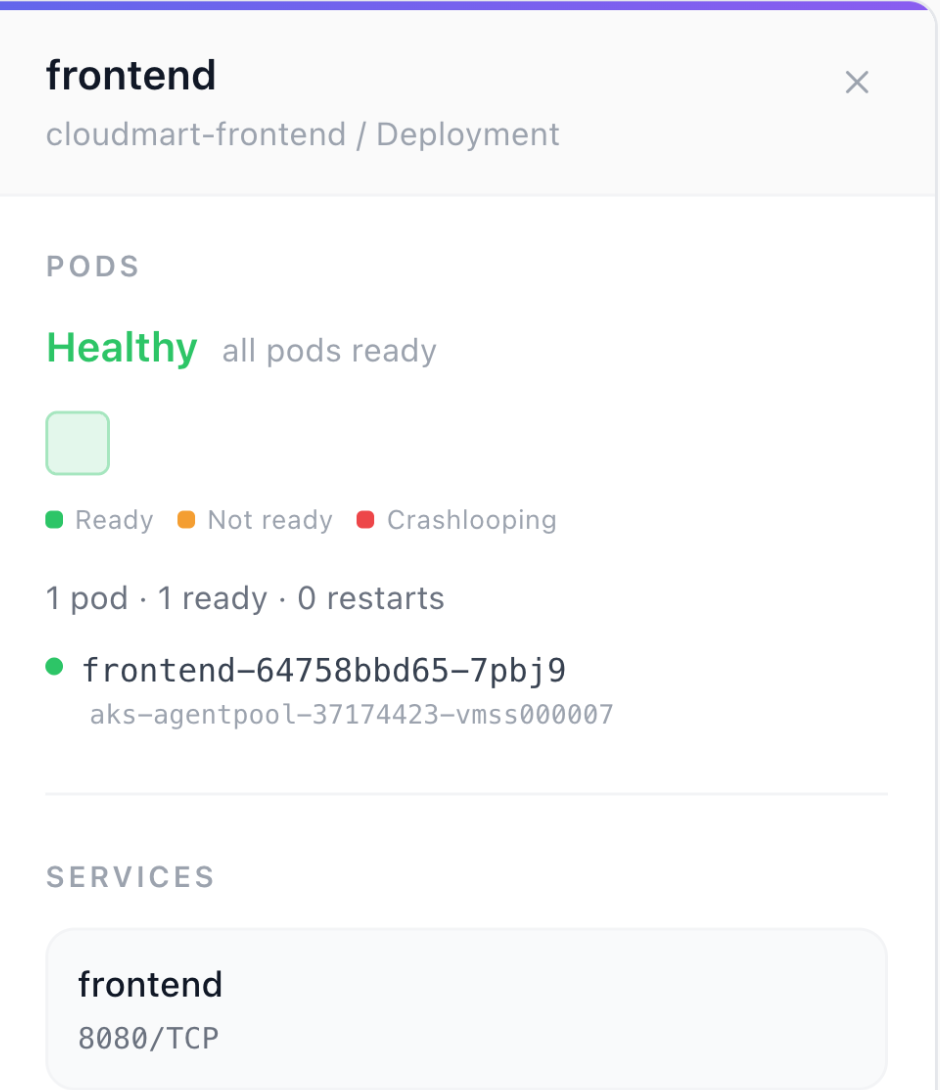
Pod restart counts, readiness, crashloop and zombie detection, and node hotspots are available as dashboard widgets — and the observe page now shows each workload's live health at a glance with a colour-coded vitals view. Workload health and network posture, in one place.

Nyx workload vitals panel showing the frontend deployment as healthy, with pod readiness, restart count, and services.

Product lens

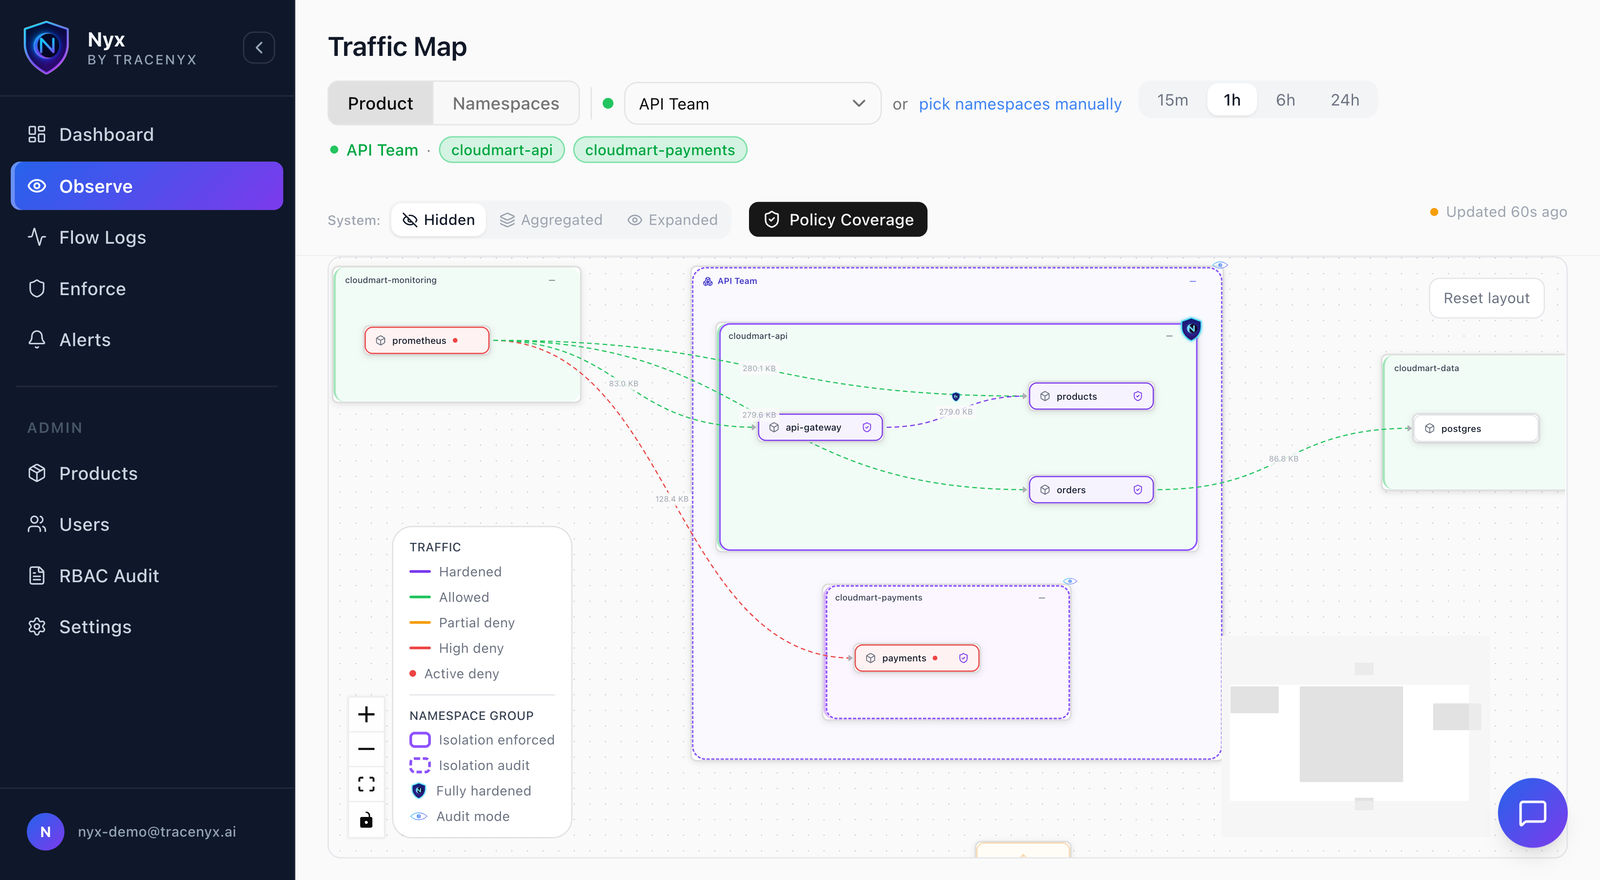
Shared clusters are the norm; shared noise doesn't have to be. You can now filter everything — dashboards, flow logs, observe, and enforcement views — down to a single product.

The product lens shows your product's security perimeter: what stays inside it, what crosses in, and what leaves. It also shows your product's policy coverage, so a team can see exactly how much of its own surface is governed — without wading through everyone else's traffic.

Nyx traffic map filtered to the API Team product, showing its namespaces, traffic flows, and policy coverage.
Learn more about products in the docs

Improvements & fixes

  • Connection-rate dashboard widget — live connection rate charted against your namespace's seasonality-aware baseline, so spikes read as spikes, not guesses.
  • Better TLS visibility — destinations revealed by TLS SNI are now captured end to end, so egress to HTTPS endpoints is visible by hostname rather than IP.
  • More reliable enforcement — established connections now deterministically survive a new-connection deny, with identical behaviour on Linux and Windows. Parity that's real, not a checkbox.
  • Smarter AI — the models behind natural-language querying and policy generation have been upgraded for more accurate answers and better-fitting policy suggestions.
  • Alert threshold fix — greater-than-or-equal alert thresholds now fire correctly at the boundary value.

No updates match your search.

Start enforcing zero trust today.

Free Scout tier. Three namespaces. No credit card.
Upgrade when you're ready.