Nyx Orbit — explore a live cluster, no signup
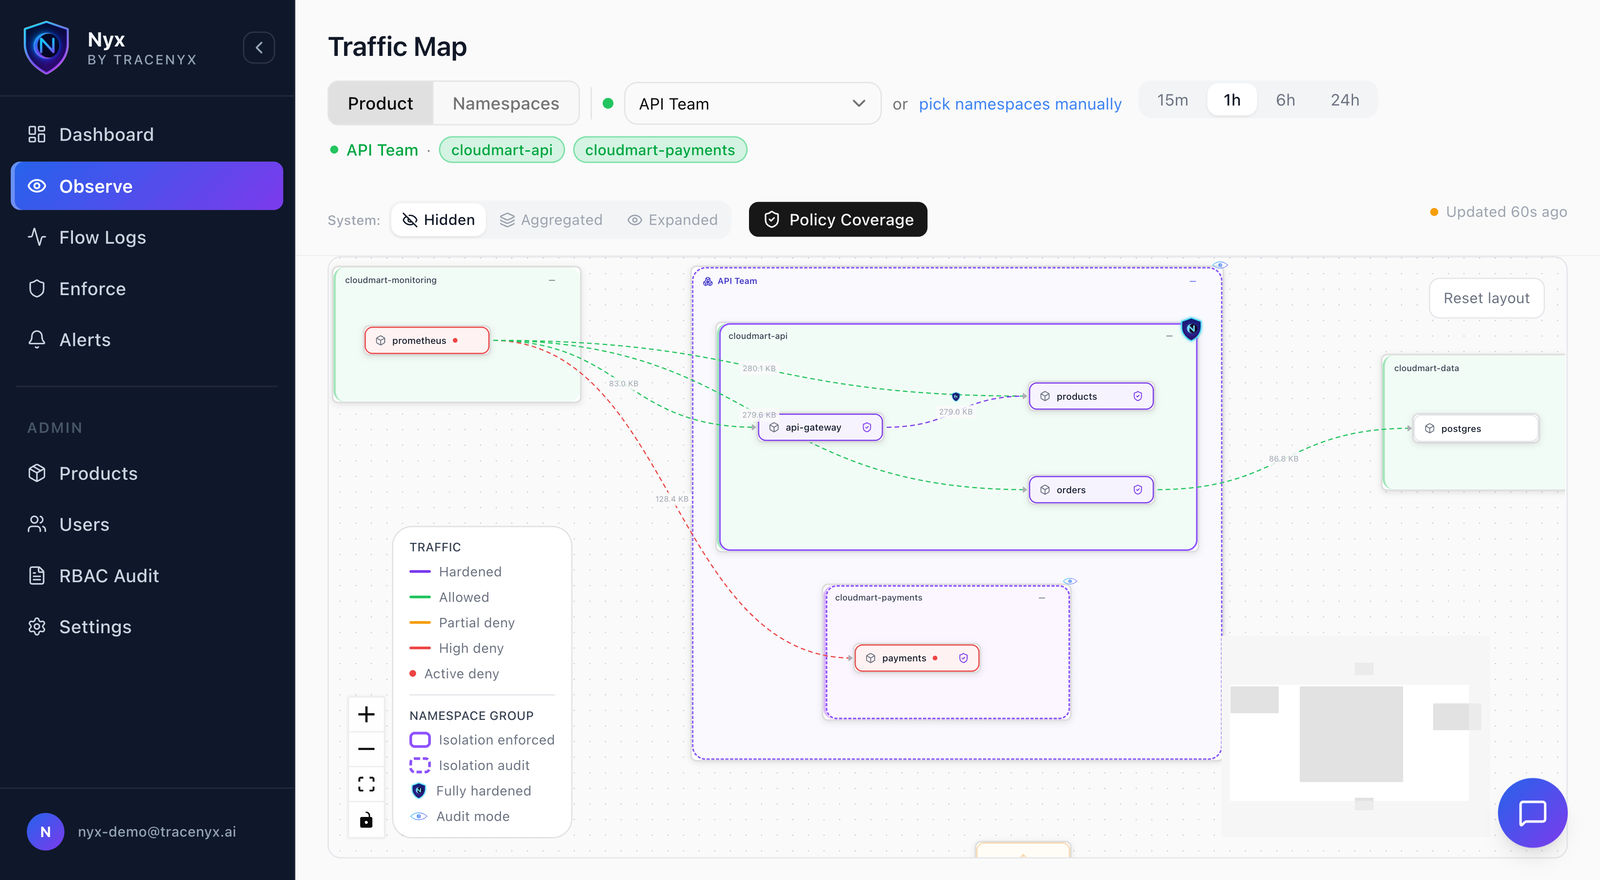
Nyx Orbit is a live, read-only Nyx environment open to everyone at orbit.tracenyx.ai. It's the actual product watching a real Kubernetes cluster — Linux and Windows workloads, live traffic, live alerts — with no signup and nothing to install.
Three guided missions give you a path if you want one: diagnose a workload that can't reach Key Vault (its logs blame auth — the network tells the real story), investigate an alert for a destination a workload has never contacted before, or ask the cluster questions in plain English and watch answers come back from live flow data. Or skip the missions and just explore — the traffic map, flow logs, dashboards, and policy drawer are all open.
We built Orbit because evaluating cluster security tooling usually means deploying a privileged agent before you know whether the product is any good. Orbit flips that: see everything first, install when you've decided it's worth your cluster.
Explore a live cluster in OrbitAlso in this release — Nyx 1.1.1
- Flow direction accuracy — a class of egress deny flows was being recorded as ingress; direction is now resolved correctly across the board.
- Hostname visibility gaps closed — flows that intermittently missed their TLS hostname now resolve it reliably, and DNS-based hostname attribution is now tracked per pod for the pod's lifetime, giving more stable FQDN resolution on busy nodes.
- Load-balancer ingress no longer double-counted — traffic arriving via a load balancer was recorded twice in some node configurations.
- Windows flow processing aligned with Linux — the Windows agent's flow-log pipeline was reworked to match Linux behaviour exactly, with test coverage to hold the line. Parity that's real, not a checkbox.
- First-seen alerts hold their window — first-seen destination alerts now stay visible and investigable for their full intended duration, and resolved events report their true peak instead of zero.
- Alert accuracy in the feed — "last fired" now shows the actual last firing time after an alert resolves, and alert descriptions now describe each rule's real condition (first-seen and anomaly rules no longer borrow threshold wording).
- Tidier egress maps — many sibling hostnames under one parent domain now collapse into a single *.parent (N destinations) entry past a threshold, keeping the topology readable for chatty workloads.
- Alert history improvements — new 6-hour range (now the default), paging for long histories, and an explicit notice when the display cap is reached.
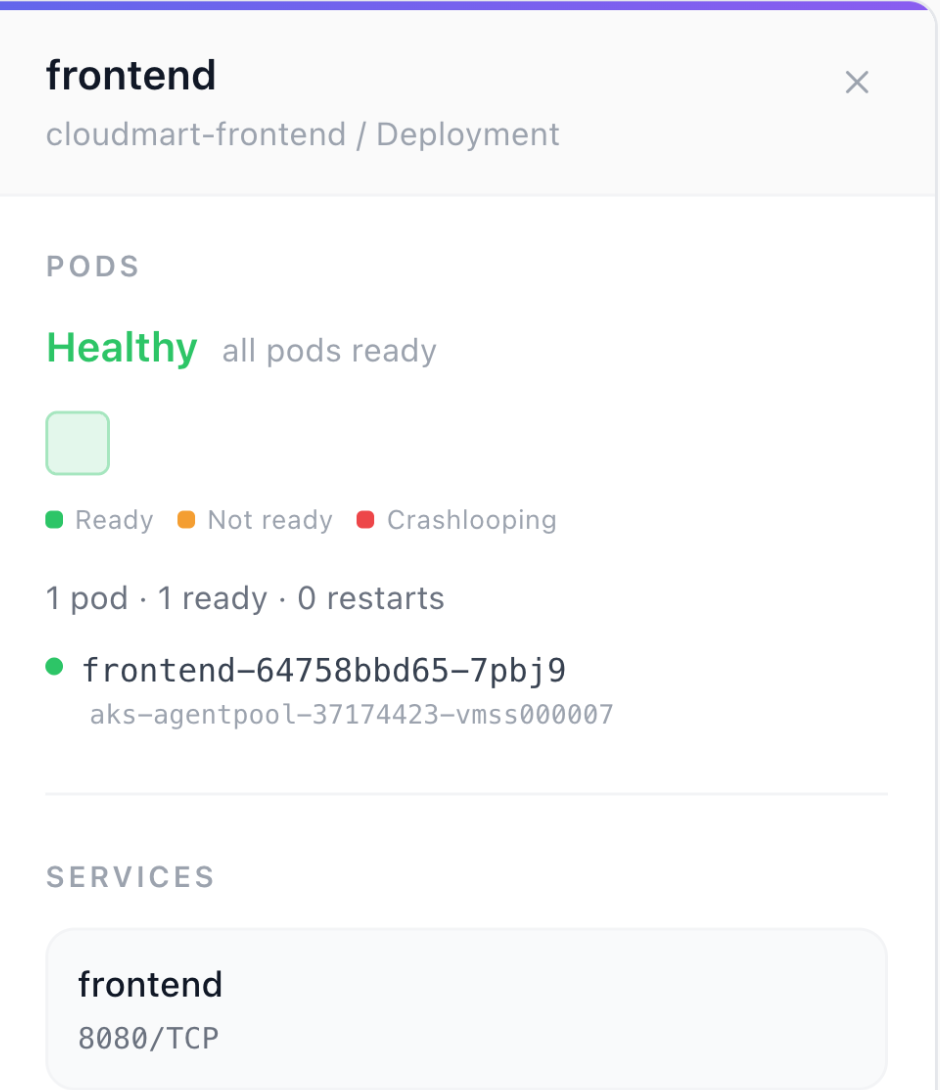
- In-product guidance — feature tours and tooltips across the topology map, service graph, flow logs, and dashboards; product and namespace detail panels; a per-workload detail sheet.